2. System Overview#
Note
As PVPlant is initially a South African product intended for a South African market. International readers may find this information South Africa centric, which may not be fully applicable to other localities. It is my intention to first focus on South Africa, before looking further afield. That said, I am receptive to collaborative contributions that incorporate other localities while I focus on South Africa.
PVPlant system overview is illustrated in Figure 2.1: .
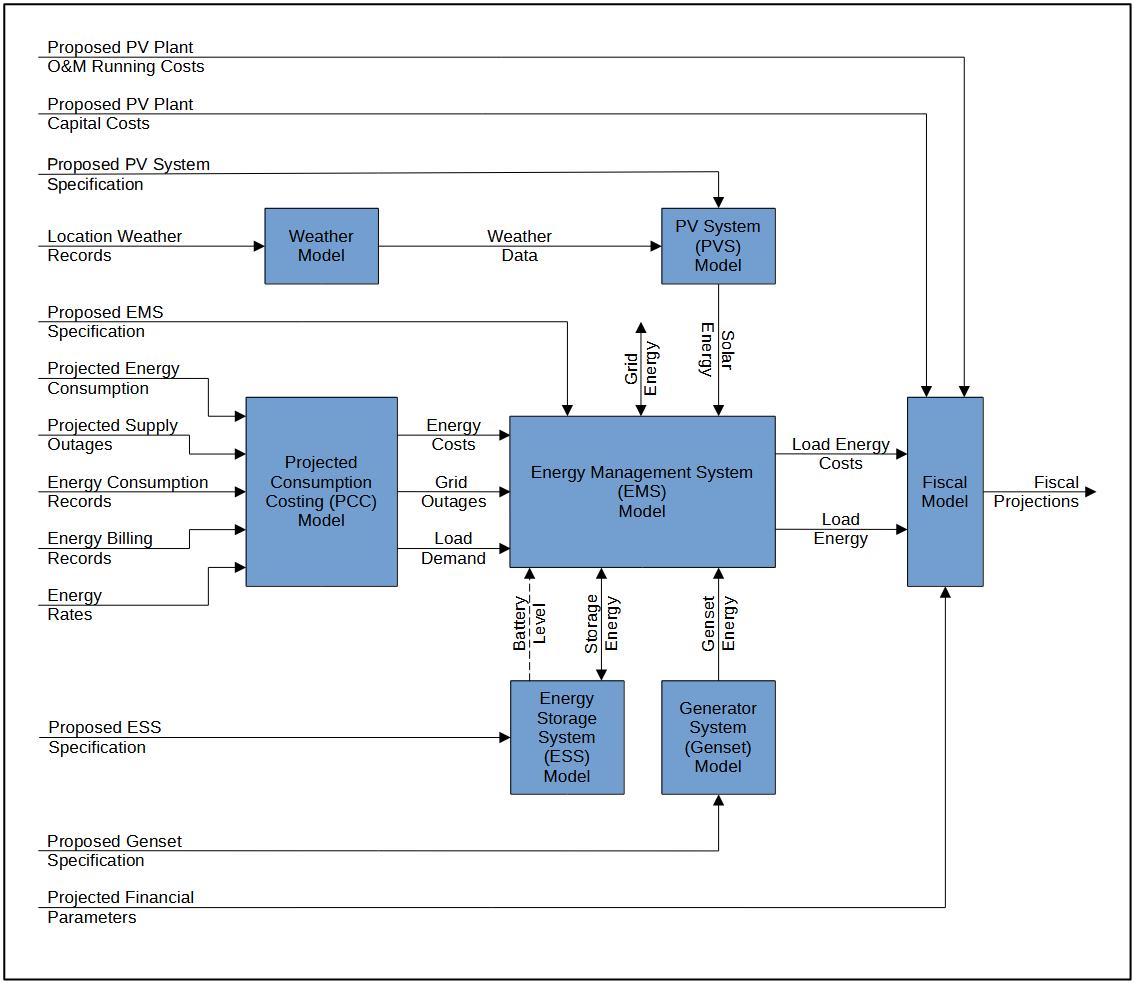
Figure 2.1: PV Plant Tool Scope#
The PVPlant tools accepts information as inputs that is processed through models creating intermediate data, which in turn is processed through other models to ultimately arrive at Fiscal Projections, the resulting output data.
2.1. PVPlant Components#
2.1.1. Weather Model#
The weather model accepts location weather records which are available from various sources, and produces time-series Weather Data profile that is processed by the PV System Model can process.
2.1.2. Projected Consumption Costing Model#
A forward-looking Load Demand profile for the following year is generated from historical energy consumption records coupled with Projected Energy Consumption information.
- A prediction of anticipated load-shedding is translated into a Grid Outage profile for the following
year
Historical billing records, together with current Energy Rates and anticipated changes are used to generate an Energy Cost profile for the following year
The Load Demand, Grid Outage and Energy Cost profiles are inputs to the EMS Model
The PCC model projection range is typically a fiscal year. Energy consumption and costs include both electricity and fossil fuel.
2.1.3. PV System Model#
The PV system model uses a Weather Data profile to predicts solar energy output of a PV system. The generated Solar Energy profile is an input to the EMS Model.
This model characterises the interaction and performance of all the components in a PV Systems taking into account their efficiencies and losses.
2.1.4. Genset Model#
The Genset specification is used by the Genset Model to generate a Genset Energy Profile useful to the EMS Model.
This profile associates fuel consumption with energy production, characterising the efficiencies and losses of the Genset.
2.1.5. Energy Storage System Model#
The Energy Storage System (ESS) Model characterises the charging and discharging capacity, rates efficiencies, losses of a the energy storage device (typically batteries), together with the components that transform energy to and from the form compatible with the storage device.
An ESS can be charging, discharging or static. It cannot be both charging or discharging.
This Model iterates in lockstep with the EMS model. For each time step iteration, the EMS Model senses the Battery level, which it factors into its calculations to decide how much Storage Energy to take from or give to the ESS Model. The ESS Model computes the Charge Energy that actually gets stored or drawn and adjusts the battery level accordingly for the next lockstep iteration.
2.1.6. Energy Management System Model#
The Energy Management System (EMS) Model iterates over every time interval. From the inputs for every time interval, based on energy cost and availability for that time, it computes the amount of energy to take from each energy source to satisfy Load Demand, charge batteries or export back to the grid.
This way the EMS manages power from the Genset when there are extensive outages, holds sufficient ESS charge to carry over load-shedding outages, and sufficient ESS charge to supplement Load Demand peaks. All the while maximising Solar energy utilisation as much as possible. How the EMS manages this is governed by the parameters in the EMS specification.
The EMS Model produces a Load Energy profile. This profile contains the amount of energy drawn from or exported to each Energy source. Accompanying this profile is a Load Energy Cost profile. These two profiles are useful to the Fiscal Model. These profiles cover the first full year of PV Plant operation.
2.1.7. Fiscal Model#
The Fiscal model uses the Load Energy and associated costs to calculate a time-series cost of energy production. This information is compared with the cost of Load Demand supplied totally from grid and existing genset, or estimated costs associated with outages. This information is further processed against PV Plant CapEx and OpEx, and projected financial parameters to produce a cost and saving financial profile for the first year of operation.
Then with financial projections such as inflation rate, interest rates, energy supply cost escalations, component deterioration, etc. the annual numbers are projected for the lifetime of the PV Plant, from which financial management information is distilled which is useful in assessing the viability and return on investing in a the PV Plant.
2.2. PVPlant Information#
2.2.1. PVPlant Time Base#
A single time base for intermediate and final time-series data, keeps data consistent, makes this information easier to follow and simplifies implementation of PVPlant.
PVPlant’s time base is half-hourly over a non-leap year from 1 Jan, 00:00 to 31 Dec, 23:00. That is 17,520 records long.
Working consistently with energies and not mixing power and energy information further simplifies impolemenation. The consistency makes the intermediate information easier to follow.
PVPlant processes input time-series information as follows:
Information is scaled or interpolated to the 1/2 hourly time base
All instantaneous power measurements are converted to their energy equivalent for the period. The energy value of a time step record is that energy between this time step and the next.
All input energy measurements need to be shifted and recalculated to be between this time step and the next. Some records list energy values where:
The energy in a time step period, equi-distant about the time step, or
The energy between the previous time step and this.
All instantaneous information like wind-speed or ambient temperature that PV Plant processes is recalculated as the average wind speed between this time step and the next, which more accurately represents the average value over the period representing the energy.
All calculated non-linear information like azimuth and apparent elevation of the sun is done at the mid-point between this time step and the next to more accurately align its value with the energy values for the period.