3.1. Weather Data#
It does matter what and whose weather data is used to predict PV Plant power output. Weather Data is not all created equally. Simply pick a location, obtain different types weather data from one or more sources, and sum or average the annual Insolation. Often the variation is more than 20%. This variation is huge in an analysis where fractions of a percentage point count.
I do not believe it is good enough to rely on the default weather record source of your favourite tool to predict PV Plant production, without understanding how the weather data was created and its limitations. It is tempting to hide behind the reputation of your favourite PV Plant modelling tool, but, will that help you explain to your customer why the plant is not producing what was predicted?
3.1.1. About Weather Data#
Weather Data of interest to PVPlant is time-series Irradiance, wind speed, ambient temperature, and sun position. The Irradiance is made up of DNI, DHI and GHI. The Sun’s position is specified by its azimuth and apparent elevation.
Weather Data selection is far more complex than one would think. Let’s proceed down a short rabbit hole of the complexities, or skip to Section 3.1.1.7: . PVPlant.
3.1.1.1. Position of the Sun#
The sun’s position from any point on the surface on earth is specified by its azimuth and apparent elevation.
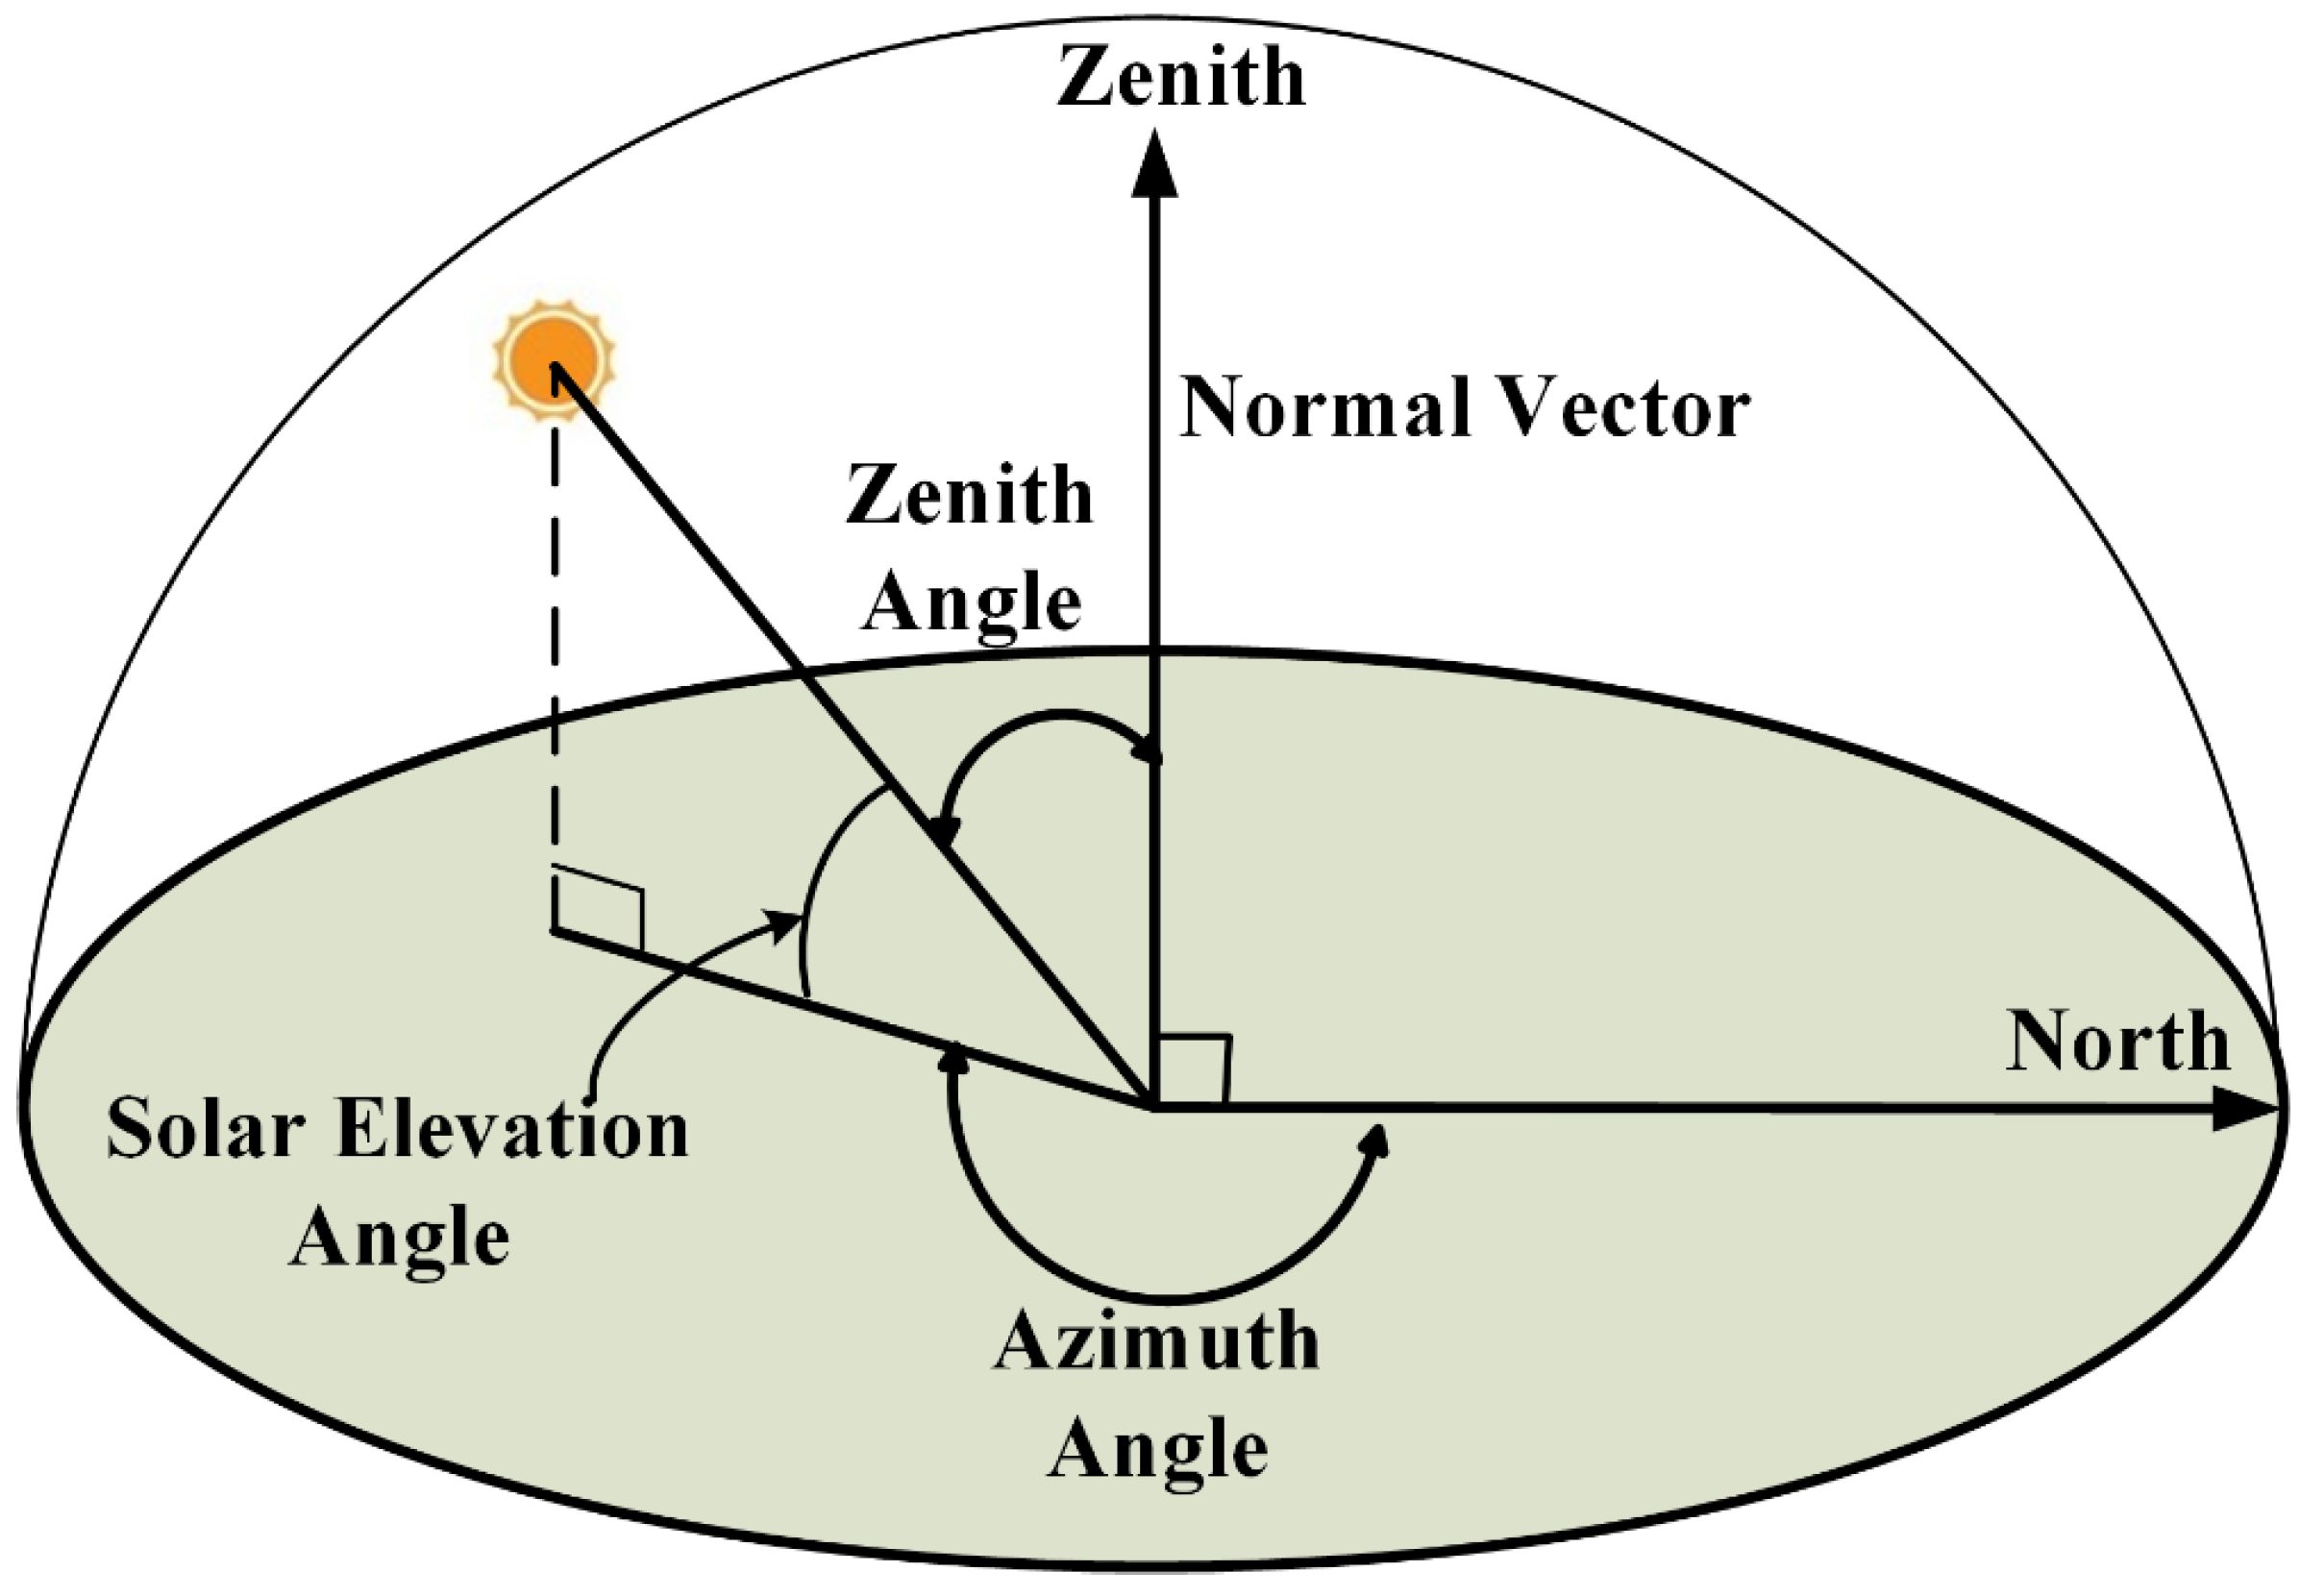
Figure 3.1: Solar Position - Azimuth and Elevation#
Elevation is angle that the sun’s rays make with the horizontal surface of the earth. The suns rays bend progressively by a small amount the closer the sun is to the horizon, due to the increased distance rays travel through the earth’s atmosphere. The apparent elevation value accounts for the slight refraction through the earth’s atmosphere.
Azimuth is the horizontal surface angle clockwise from North to the horizontal component of the Sun’s elevation
3.1.1.2. DNI, DHI and GHI#
Irradiance is the instantaneous power (W/m2)from the sun on a (horizontal) surface 1 m2. Insolation is the accumulation of radiant power on this surface over the period of an hour. (Wh/m2). Irradiance is to power what Insolation is to Energy.

Figure 3.2: Irradiance - DNI and DHI#
The important Irradiance Data numbers are:
DNI: Direct Normal Irradiance is the direct ray of light emanating from the sun on a surface perpendicular to the sun, 1 m2
DHI: Diffuse Horizontal Irradiance is the sun’s irradiant power that is scattered by aerosols in the atmosphere. DHI is present at all angles and appears equally on a 1 m2 surface at any orientation, tilt and slope.
GHI: Global Horizontal Irradiance is all the radiant light falling on a horizontal surface 1 m2. It is the sum of the vertical component of DNI and DHI.
(3.1)#\[GHI = DNI \times sin(e) + DHI\]where e is the apparent elevation angle of the sun.
3.1.1.3. Capacity Factor#
Capacity Factor is a useful metric in assessing the power production performance. It is the ratio of actual or predicted annual power production of a PV Plant to it’s name-plate power production.
For example, say a Plant has 100 – 550Wp modules, and according to a power production prediction calculation, has an annual energy production of 90MWh. The capacity factor is calculated as:
Typical real world Capacity Factor percentages range between 10 and 25 percent.
Any location on earth has theoretical Maximum Capacity Factor depending on its weather. It is calculated as follows:
For example, say a location experiences an Annual Insolation of 2MW/m2.
3.1.1.4. Weather Data Providers and Sources#
In the spirit of open information and public availability, Weather Data from like-minded organisations are considered. The Weather Data organisations considered here are NREL, PVGIS, and CAMS
[13] and [17] lists three types of weather sources:
3.1.1.4.1. Ground Weather Stations#
Ground Weather Stations take actual irradiance weather measurements at specific geographic locations. When the measuring equipment is high quality, calibrated and operating correctly, these weather stations log the most accurate information for that location. However, equipment needs periodic calibration and maintenance and does go faulty from time to time leaving holes in the accurate information. Some ground stations make their weather data publicly available.
Because of the large expense of maintaining high quality weather stations they are rather scarce. At the time of this writing [12] identifies only 10 active sites in the whole of South africa as shown in Figure 3.3: . The blue dots represent active sites, the red dots, inactive sites.
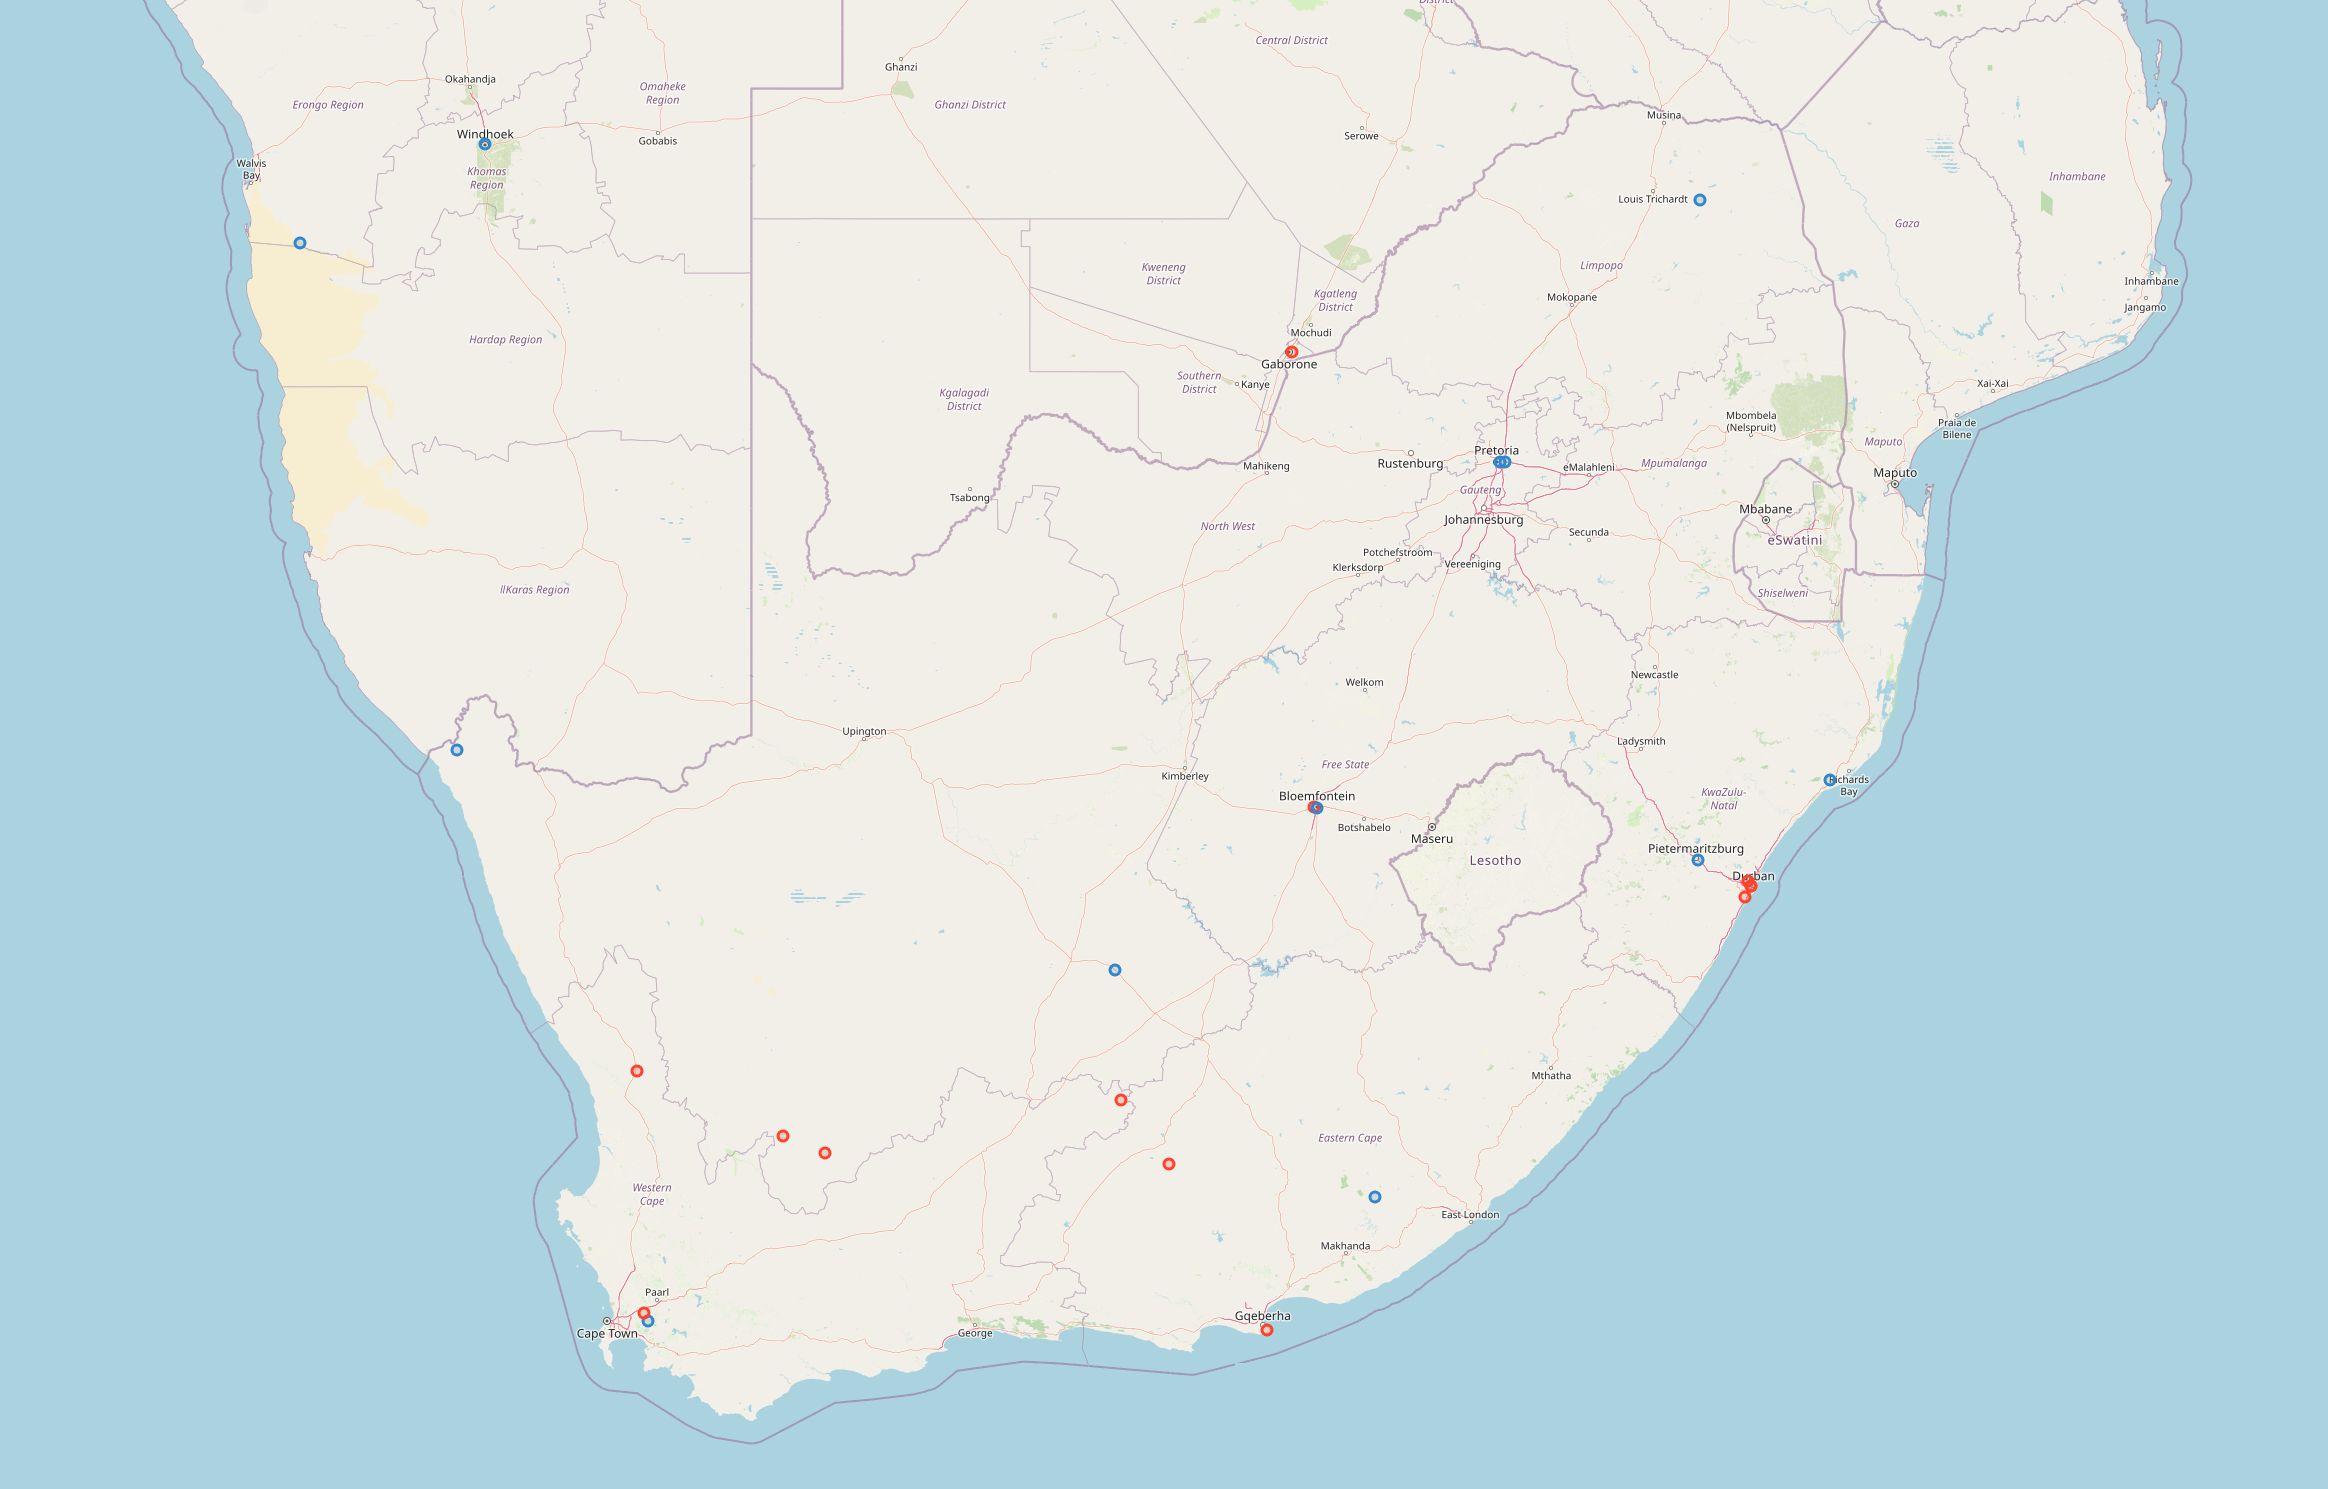
Figure 3.3: Solar Ground Weather Stations#
Unless the PV Plant being proposed is close to one of these sites, this data is not really an option for PVPlant.
A purpose of these ground station measurements is to verify the computation of Irradiance Data modelled from satellite data.
3.1.1.4.2. Satellite Data#
There are a number of research and commercial entities that analyse data from weather satellites observing cloud cover and air turbidity, which is then processed through their irradiance and atmospheric models, producing reasonably accurate irradiance estimates. These model estimates are improved from time to time by comparing them with ground station measured results.
Satellite data has uniform spatial resolution in the satellite’s geographical coverage, typically 0.05° latitude × 0.05° longitude (≈ 5 km × 5 km). Some Data providers even provide interpolated values to the exact location.
The temporal resolution of satellite data is also very good, typically sub hour. There are no holes or periods of uncalibrated data like one finds in measured data.
Reasonable accuracy together with high spatial and temporal resolutions make satellite data attractive for PV Plant power production predictions.
3.1.1.4.3. Reanalysed Data#
Reanalysed data increases geographical coverage by deriving irradiance estimates from weather forecasting data. The uncertainties of reanalysed data is much higher than satellite data, making it the option to only use for locations without satellite data. Spacial resolutions are typically 0.25° latitude × 0.25° longitude (≈ 25 km × 25 km).
3.1.1.5. Types of Weather Data#
3.1.1.5.1. Typical Meteorological Year (TMY) Data#
The median data for a particular month is calculated from a data set, and the actual year whose monthly data is closest to the calculated median is taken as the Typical Meteorological Month for the TMY. Typically, weightings are given to certain data items in determining the median month.
The approach is the same but different data set providers implement the details differently.
NREL describe their data sources and how they calculate TMY data in [20] and [4]. NREL TMY data is based on ground observations, and in the whole of Southern africa data is either observed in Harare, Johannesburg or Capetown. The site requires latitude and longitude coordinate entry and then shows how far this site is from the closest dataset.
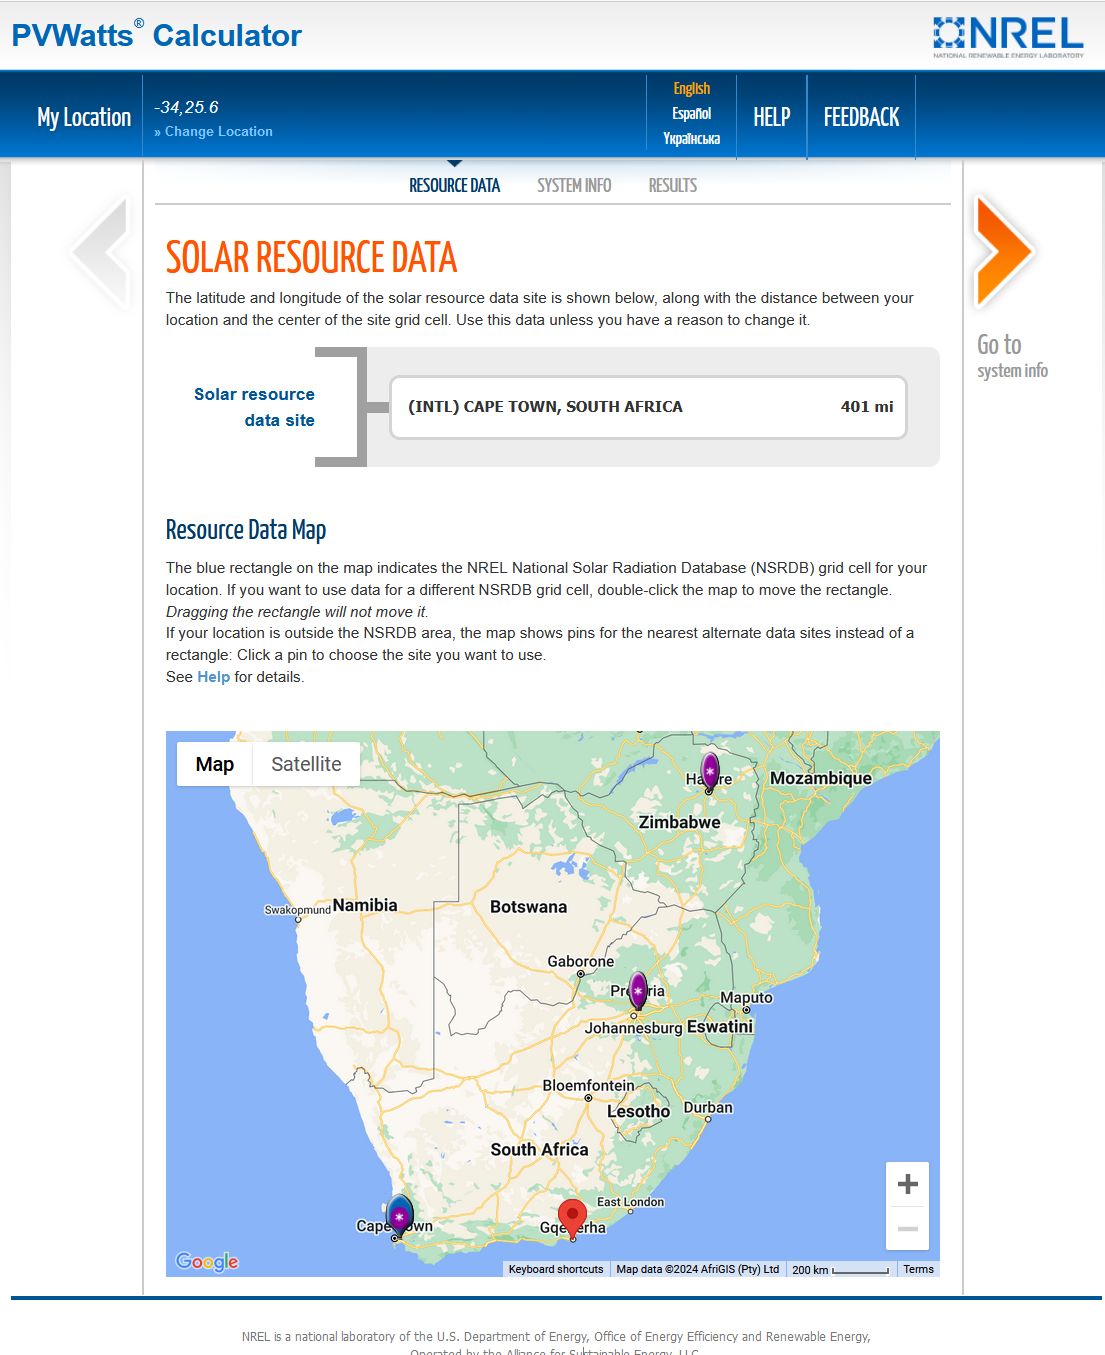
Figure 3.4: PV Watts Data Source Selection#
PVGIS describe their data sources and approach in [16], [9], and [10] PVGIS TMY data appears to be derived from satellite data, so the spacial accuracy is good. Data is obtained from https://re.jrc.ec.europa.eu/pvg_tools/en/#TMY
I recall reading somewhere that the estimated uncertainty for TMY data is 3%, but I have not been able to find this reference again. Any help is appreciated.
3.1.1.5.2. Multi-year Time-series Data#
Multi-year Time-series Data is calculated from satellite data.
NREL obtains its time series information for South Africa from Meteosat IODC, but only has records for 2017 to 2019, [3]. A three-year span is insufficient to provide averages that can show the weather data pattern with sufficient certainty.
PVGIS provides time-series data gleaned from european geo-stationary weather satellites. Instantaneous hourly data values for the years 2005 through 2020 are available in their PGIS-SARAH2 Database. Their download tool allows for panel slope and azimuth – setting these value to zero downloads horizontal surface irradiance values, [5], [7], and [8].
CAMS [2], [14] only provides time series data to 1 minute temporal resolution, interpolated to location of interest from 2 January 2004 to present minus two days [1]. It is possible to compute annual average time-series and TMY time series from these data-sets with reasonable uncertainties.
3.1.1.5.3. Theoretical Clearsky Model#
Many tools abound for clearsky communication models. PVPlant uses pvlib as the tool with the internal defaults https://pvlib-python.readthedocs.io/en/stable/index.html
NREL SPA - solar position, which also accounts for light refraction close to the horizon
Ineichen and Perez clear sky model Clearsky model: Perez
Kasten and Young Air mass model.
CAMS Timeseries also has an option for providing clearsky data calculated from satellite imagery which is probably more accurate as information based on current observed data is likely to be more accurate than modeled data based on historical data. But, I have no way of verifying this.
3.1.1.6. Accuracy of Data#
Ultimately, we are interested in the quality of the data selected, so we can predict PV Plant solar power performance accurately.
Irrespective of the type of weather data the more years the data covers the better. Generally the larger the sample set the lower the uncertainties, One would want to consider at least 10 years of data as a minimum
TMY data wants to eliminate weather caused by unusual and randomly occurring events such as volcanic eruptions, earthquakes, large fires, wars, and the like. Averaging Times-series data on the other hand will include a weighting of these events.
There are proponents for the use of one type or another. I personally believe averaged time-series is more representative of reality. Although there is no way of predicting when one of events occur and what their effect on weather will be, we can be certain that weather affecting events will continue to occur, and at the frequency they have occurred in the past.
As of this Writing, PVSyst and Helioscope by default use Meteonorm TMY weather data-sets. Meteonorm obtains its TMY datasets from NREL and DWD - both only providing measured data at specific locations, making them less than ideal for analysis unless the PV plant is close to a measuring station.
OpenSolar uses NREL’s SAM to model solar performance. SAM uses the NREL’s TMY data too.
Concerns about data set accuracy are real. [15] and [11]. Accuracy analysis of PVGIS and CAMS, largely cover Europe, and show reasonable but not ideal correlations with measured results. [18], [19], [6]
3.1.1.7. Concluding remarks#
As of this writing I have not found any accuracy analyses of data sets for South Africa. Predicting production of a solar plant is an art, where predictions from data-sets are really a guide. Especially so in South Africa.
PVPlant supports the use of both TMY and Time-series data, with Clearsky data providing a useful idealised reference.
Personally, I favour averaged time-series data over TMY data. If TMY data is required, use PVGIS’s TMY information. When it comes to Time Series, CAMS provides data that can be used without manipulation whereas PVGIS data requires some interpolation and conversion of irradiance numbers to insolation. Also, there are more years available in the CAMS data set.
Because of the variability of data, a good approach may be to calculate annual solar production using PVGIS TMY, PVGIS time series and CAMS time series data, to judge where the actual plant production may fall.